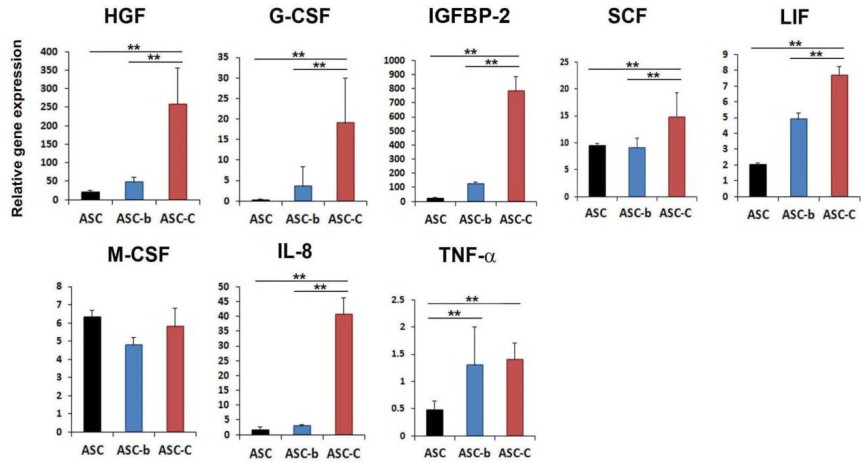
Fig. 3. The expression patterns of multiple hepatogenic and chemotactic factors were measured by qRT-PCR. The data are presented as fold change compared with the mononuclear cell group. Individual values were normalized to glyceraldehyde 3-phosphate dehydrogenase (GAPDH). n = 4 per group. *p<0.05; **p<0.01.